Probability & Statistics in Engineering
Fall 2023 - 21 Nov
Example
- A construction firm has just purchased a large supply of cables that have been guaranteed to have an average breaking strength of at least 7000 psi
- To verify this claim we take a random sample of 10 of these cables
- We calculate the sample mean and other sample properties
- How do we ascertain that the population mean is at least 7000 psi?
Hypothesis testing
A statistical hypothesis is a statement about the parameters of one or more populations.
- Hypotheses are the two competing statements
- Closely related to confidence intervals
Hypotheses
Null hypothesis: \(H_0: \theta = \theta_0\)
Alternative hypothesis: \(H_1: \theta \neq \theta_0\)
- Null hypothesis is most of the time an equality claim
- Unless alternative hypothesis is \(>\) or \(<\)
- When \(H_1 < \theta_0\) or \(H_1 > \theta_0\) then one-sided alternative hypothesis
Developing the hypothesis test
- interested in the burn rate of a propellant
- \(h_0: \mu = 50\,\text{cm/s}\)
- \(h_1: \mu \neq 50\,\text{cm/s}\)
- sample of \(n=10\) specimens
What is the distribution of the sample mean?
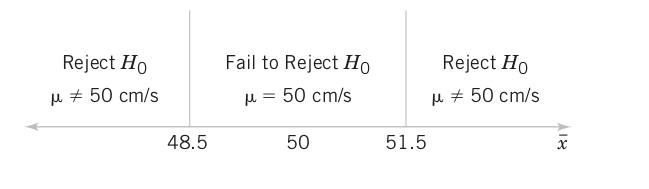
- Acceptance region
- Critical region
- Critical values
- We reject \(H_0\) if values fall inside the critical region
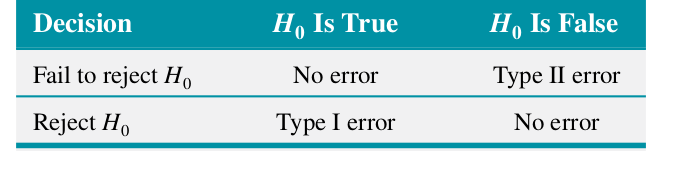
Hypothesis testing errors
- Type I Error
- Rejecting the null hypothesis when it actually is true
- Type II Error
- Failing to reject the null hypothesis when it is actually false
Probability of Type I error
\[\alpha = P(\text{type I error})=P(\text{reject }H_0\text{ when }H_0\text{ is true})\]
This probability is also called the significance level (or the size of the test)
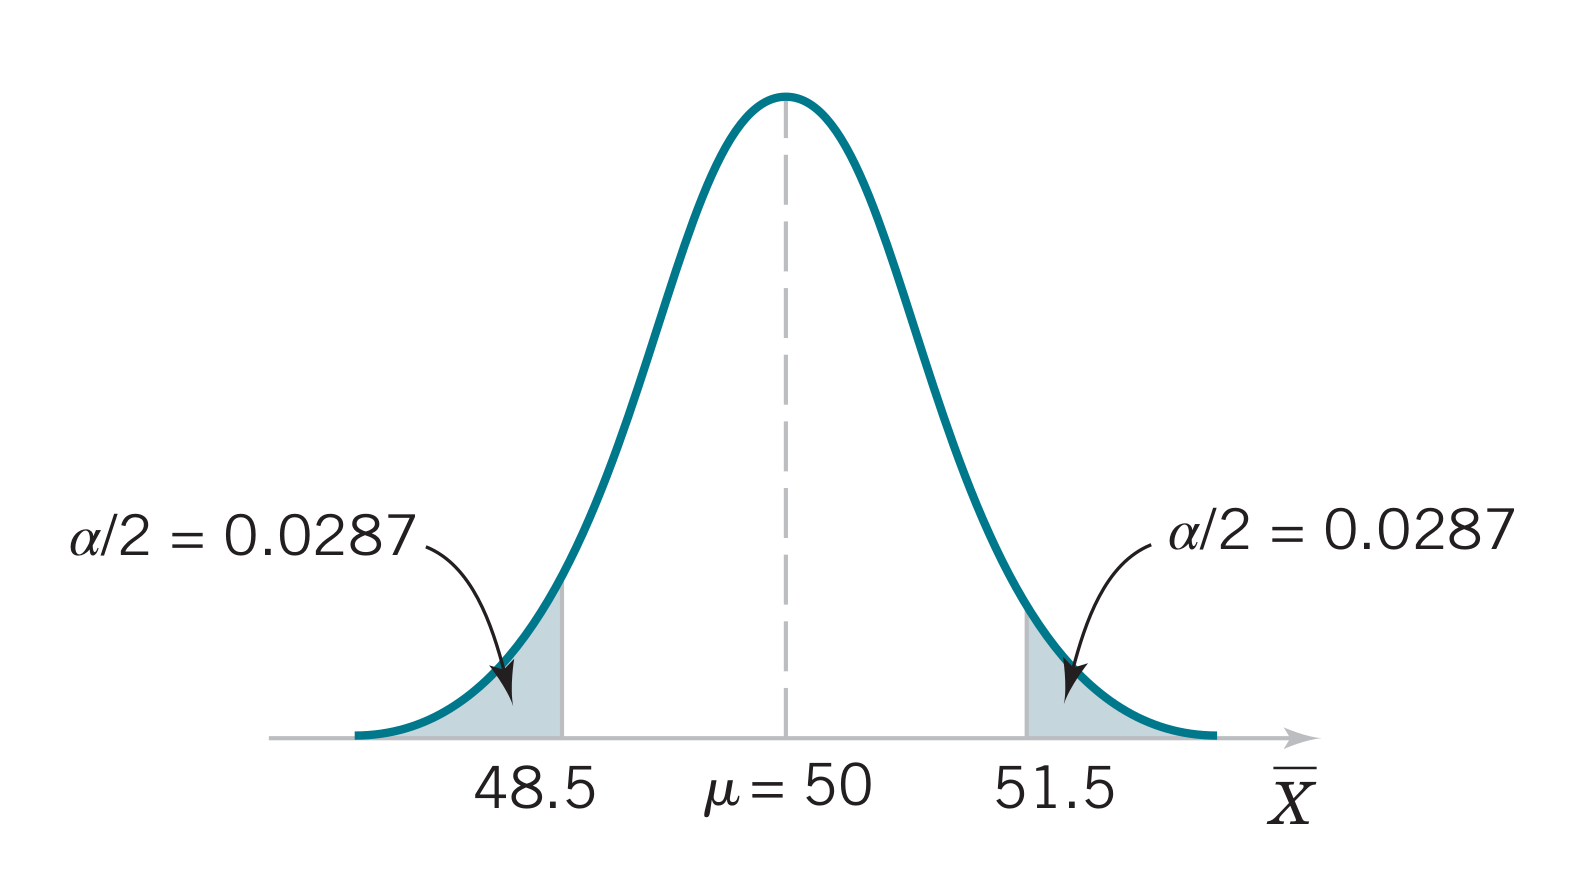
How can we reduce \(\alpha\)?
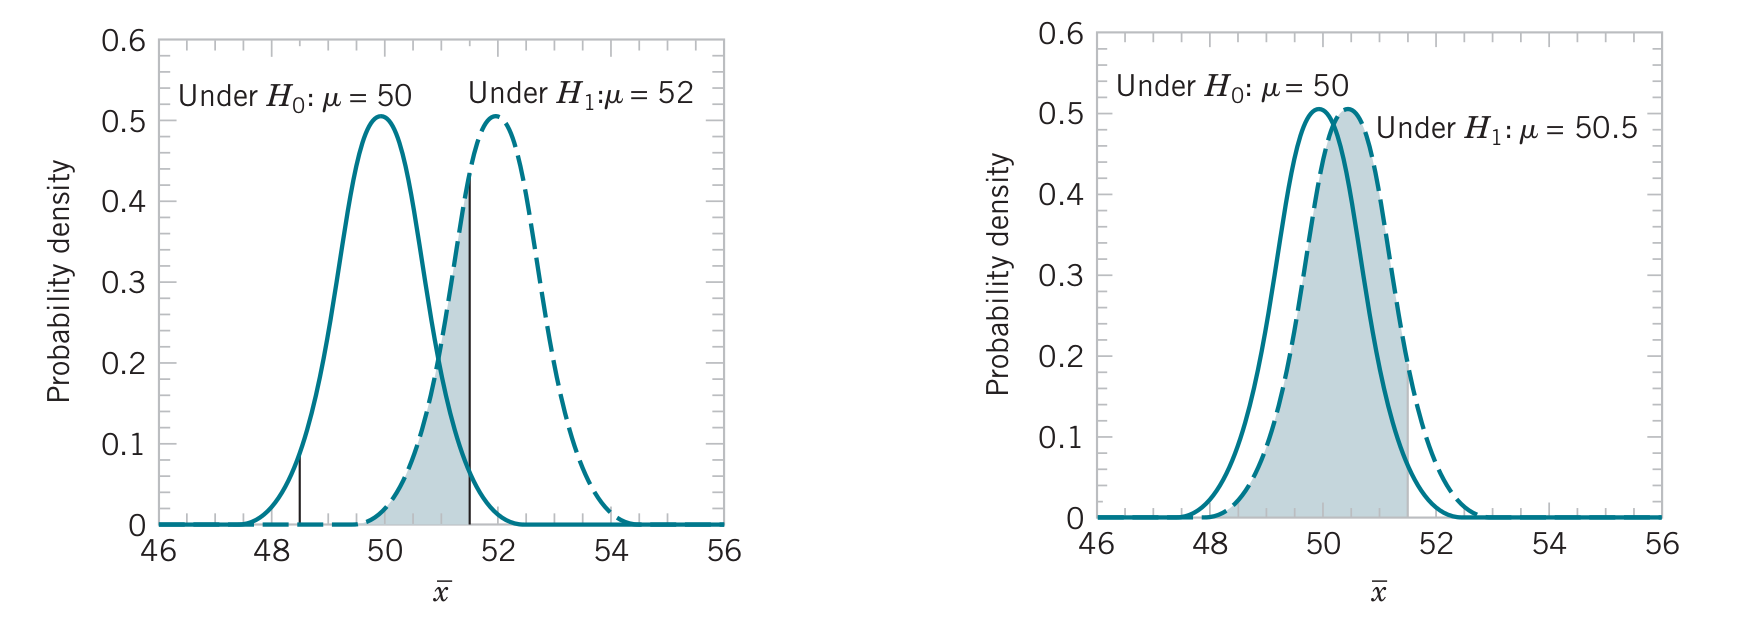
Probability of Type II error
\[\beta = P(\text{type II error})=P(\text{fail to reject }H_0\text{ when }H_0\text{ is false})\]
The probability of a type II error increases rapidly when the true value of \(\mu\) approaches the hypothesized value
Summary
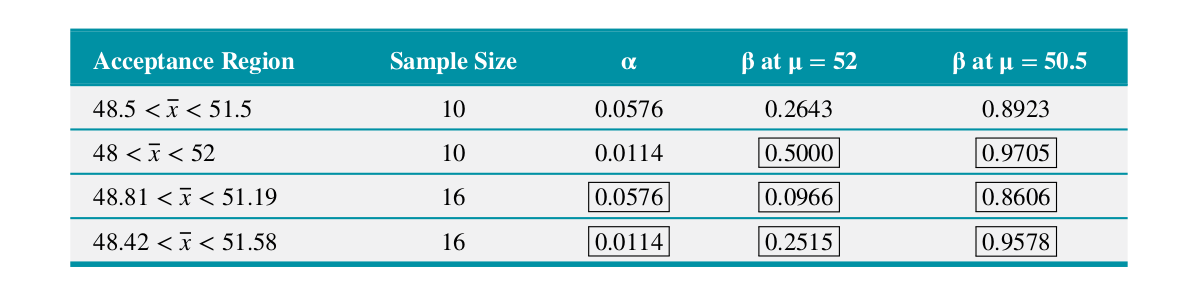
- Size of the critical region (\(\alpha\)) can be reduced by appropriate selection of critical values
- Type I and II errors are related: a decrease in the probability of one type of error always leads to the increase in the probability of the other (assuming \(n\) is constant)
- An increase in \(n\) reduces \(\beta\) (assuming \(\alpha\) is constant)
- When the null hypothesis is false, \(\beta\) increases as the true value of the parameter approaches the hypothesized value (and vice versa)
Power of a hypothesis test
The power of a statistical test is the probability of rejecting the null hypothesis \(H_0\) when the alternative hypothesis is true.
- Power is computed as \(1-\beta\)
- Probability of correctly rejecting the false null hypothesis
- If the test's power is deemed too low then we can either increase \(\alpha\) or \(n\)
p-values in hypothesis tests
- Fixed significance level
- Can be limited as it a priori defines a risk associated with the value of \(\alpha\)
The p-value is the smallest level of significance that would lead to rejection of the null hypothesis \(H_0\) with the given data.
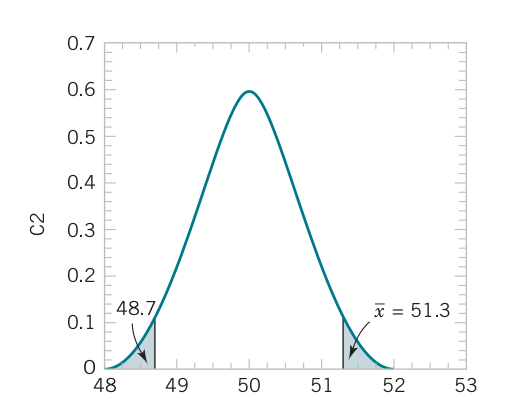
Example
\[H_0: \mu=50;H_1: \mu \leq 50\]
Assume \(n=16\), \(\sigma=2.5\) and \(\overline{x}=51.3\)
\[P\text{-value}=1-P(48.7<\overline{X}<51.3)\] \[=1-P(-2.08< Z <2.08)\] \[=0.038\]
p-values are a random variable

General procedure for hypothesis tests
- Parameter of interest: identify the parameter
- Null hypothesis, \(H_0\): state the null hypothesis
- Alternative hypothesis, \(H_1\): specify an appropriate alternative hypothesis
- Test statistic: determine the appropriate test statistic
- Reject \(H_0\) if: state the rejection criteria
- Computations: compute any sample quantities and test statistics
- Draw conclusions: Decide whether \(H_0\) can be rejected or not